
Comparing Air Quality Targets Around the World - Part 4: Inorganic Gases & Radon
Table of Contents
Conclusion: What the Ozone, NO₂, SO₂, and Radon Targets Tell Us
Appendix: Standards List and Resources for Inorganic Gases & Radon
Air quality targets around the world are used to define what "clean air" means. Yet a building that complies with one standard may fail another, with acceptable limits for the same pollutant differing by as much as twenty-fold depending on the framework.
This comparison examines how 16 government standards and green building certifications across North America, Europe, and Asia-Pacific define acceptable exposure to ozone (O₃), nitrogen dioxide (NO₂), sulfur dioxide (SO₂), and radon. Although each aims to protect occupant health, they reflect different assumptions about health risk, exposure duration, and the practical realities of controlling these pollutants within buildings.
Unlike particulate matter or volatile organic compounds, these pollutants do not share a common source or mitigation strategy. Ozone, nitrogen dioxide, and sulfur dioxide are closely tied to outdoor air pollution and combustion, while radon enters buildings naturally from the ground. As a result, meeting indoor air quality targets depends not only on air filtration and ventilation, but also on building location, mechanical systems, and even foundation design.
Understanding these differences helps explain why air quality standards diverge, why compliance with one framework does not necessarily guarantee compliance with another, and why interpreting concentration limits requires considering both the pollutant and the averaging period being measured.
About This Series
This article is Part 4 of 4 in the Air Quality Target Comparison Series. We are splitting the full master comparison into four focused articles for readability:
Part 1 — Particulate Matter: PM2.5 & PM10
Part 2 — Carbon Gases: CO2 + CO
Part 3 — Organic Chemicals: TVOC + Formaldehyde
Part 4 — Inorganic Gases & Radon: Ozone, Nitrogen Dioxide, Sulfur Dioxide, and Radon
Standards referenced in this series (16 total): WHO 2021, EPA NAAQS, EU Directive 2024/2881, Singapore SS 554 (2021), China GB/T 18883, RESET Air v2.0, LEED v5 O+M, WELL v2, Fitwel, Living Building Challenge (LBC), ASHRAE 62.1 (2022), DGNB, BOMA BEST, Singapore Green Mark, HKGBC BEAM Plus, and China Green Building Standard.
How to read this comparison
Averaging periods matter. Different standards use different averaging periods, and concentration limits should therefore be interpreted together with their corresponding exposure durations.
Short: Short-term peak exposure (15m, 30m, 1h)
Daily: Workday or daily exposure (4h, 8h, 24h)
Annual: Long-term chronic exposure
Unspecified: The standard does not define an averaging period for the reported limit
In this report, Daily, Short-term, Annual and Unspecified limits are grouped together to improve readability and allow for a clearer comparison of how targets change across different averaging periods, from short-term to annual exposure.
Type: Each standard is marked as Government (national codes, regulations, guidelines) or Certification (voluntary building certification or private framework).
Introduction - Different Sources, Different Controls
Ozone (O₃), nitrogen dioxide (NO₂), sulfur dioxide (SO₂), and radon affect indoor air quality through very different pathways. Ozone and sulfur dioxide are generally associated with outdoor air pollution; nitrogen dioxide can enter from outdoors or be generated by indoor combustion; and radon enters from the ground.
That distinction matters because no single filtration or ventilation strategy can address every pollutant. Effective control depends on identifying the source, the route into the building, and the appropriate engineering response.
| Pollutant | Typical pathway into indoor space | Primary health concern | Primary control focus |
|---|---|---|---|
| Ozone (O₃) | Outdoor photochemical smog; occasionally ozone-generating equipment | Respiratory irritation, asthma, and reduced lung function | Manage polluted outdoor-air intake; use gas-phase filtration where needed; avoid ozone-generating devices |
| Nitrogen dioxide (NO₂) | Outdoor traffic/combustion emissions and indoor fuel-burning appliances | Airway irritation and aggravated respiratory disease, including asthma | Control or exhaust combustion sources; manage outdoor-air intake and gas-phase filtration where needed |
| Sulfur dioxide (SO₂) | Outdoor industrial and combustion emissions | Respiratory irritation and asthma-related effects | Assess local outdoor conditions; manage intake timing and filtration where warranted |
| Radon | Soil gas entering through foundations and service penetrations | Long-term lung-cancer risk | Test over an appropriate long-term period; seal entry pathways; manage pressure; use sub-slab depressurization where required |
Ozone Comparison
Comparison Results
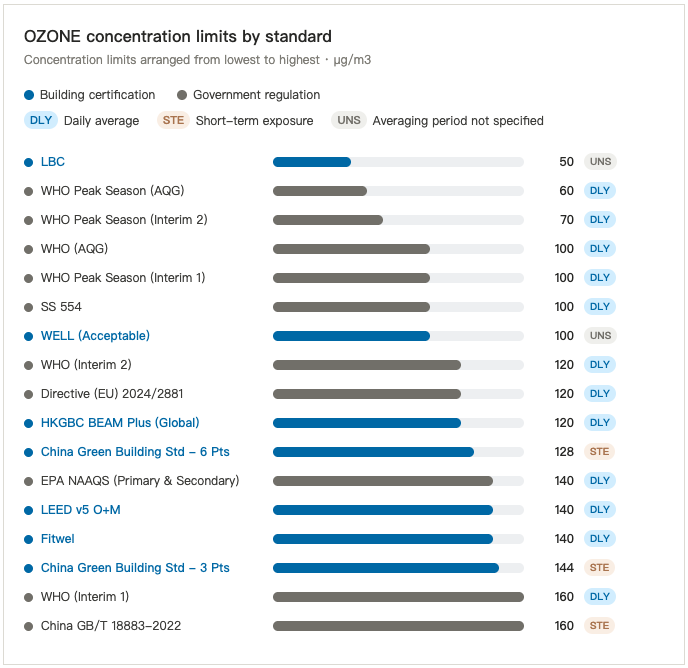
Range: 50 to 160 µg/m³, a 3.2-fold gap, across 17 limits.
Strictest: LBC at 50 µg/m³, followed by WHO Peak Season AQG at 60 µg/m³ and WHO Peak Season Interim 2 at 70 µg/m³.
Most common value: 100 µg/m³, where four limits align: WHO AQG, WHO Peak Season Interim 1, SS 554, and WELL Acceptable.
WHO alignment point: WHO AQG at 100 µg/m³ (Daily, Government) aligns directly with WELL Acceptable (UNS) and SS 554 (Daily).
Mid-range progression: Steps through WHO Interim 2, EU Directive 2024/2881, and HKGBC BEAM Plus at 120 µg/m³, China Green Building Std (6 Pts) at 128 µg/m³, and EPA NAAQS, LEED v5 O+M, and Fitwel at 140 µg/m³.
Upper end: China Green Building Std (3 Pts) at 144 µg/m³, anchored by WHO Interim 1 and China GB/T 18883-2022 at 160 µg/m³.
Type split: Government standards span the full spectrum from 60 to 160 µg/m³, while voluntary certifications cluster primarily in the 100–140 µg/m³ range.
What the Results Mean
Ozone generally enters buildings with outdoor smog, but it can also be generated indoors by ozone-producing devices and some equipment. Most green building standards (LEED, WELL, Fitwel, BEAM Plus) cluster tightly between 100 and 140 µg/m³. Unlike some other pollutants, the frameworks compared do not use an annual ozone target. Most assess ozone through short-term or daily measures, reflecting its strong day-to-day and seasonal variation; WHO additionally uses a peak-season metric to capture longer-term exposure.
Comparison Table
| Standard | Limit | Averaging | Type |
|---|---|---|---|
| LBC | 50 µg/m³ | Unspecified | Certification |
| WHO Peak Season (AQG) | 60 µg/m³ | Daily | Government |
| WHO Peak Season (Interim 2) | 70 µg/m³ | Daily | Government |
| WHO (AQG) | 100 µg/m³ | Daily | Government |
| WHO Peak Season (Interim 1) | 100 µg/m³ | Daily | Government |
| SS 554 | 100 µg/m³ | Daily | Government |
| WELL (Acceptable) | 100 µg/m³ | Unspecified | Certification |
| WHO (Interim 2) | 120 µg/m³ | Daily | Government |
| Directive (EU) 2024/2881 | 120 µg/m³ | Daily | Government |
| HKGBC BEAM Plus (Global) | 120 µg/m³ | Daily | Certification |
| China Green Building Std - 6 Pts | 128 µg/m³ | Short-term | Certification |
| EPA NAAQS (Primary & Secondary) | 140 µg/m³ | Daily | Government |
| LEED v5 O+M | 140 µg/m³ | Daily | Certification |
| Fitwel | 140 µg/m³ | Daily | Certification |
| China Green Building Std - 3 Pts | 144 µg/m³ | Short-term | Certification |
| WHO (Interim 1) | 160 µg/m³ | Daily | Government |
| China GB/T 18883-2022 | 160 µg/m³ | Short-term | Government |
NO₂ Comparison
Comparison Results
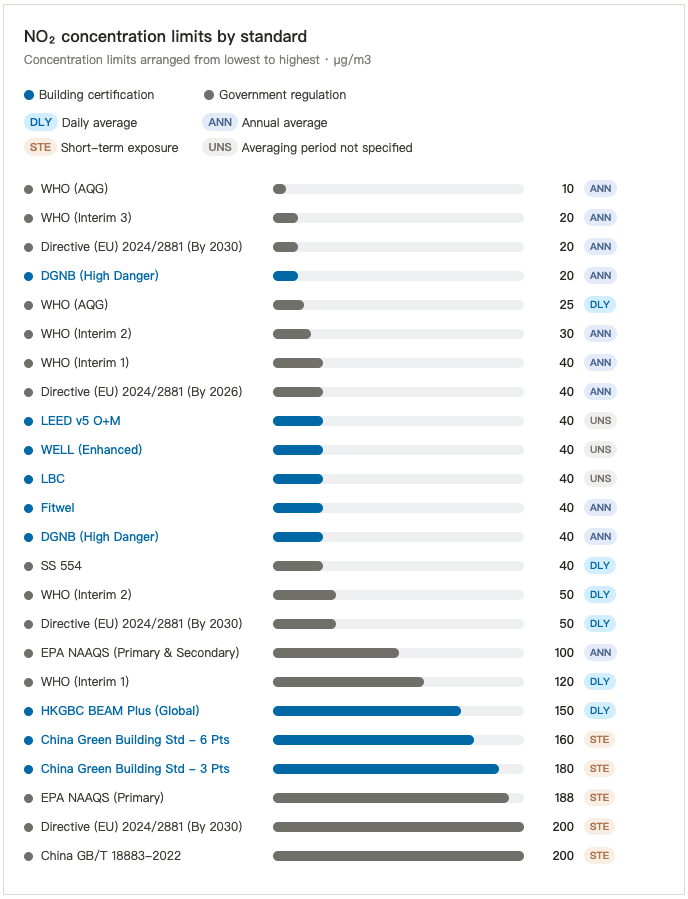
Range: 10 to 200 µg/m³, a 20-fold gap, across 24 limits.
Strictest: WHO AQG (Annual) at 10 µg/m³, followed by WHO Interim 3 (Annual), EU Directive 2024/2881 By 2030 (Annual), and DGNB High Danger (Annual) at 20 µg/m³.
Most common value: 40 µg/m³, where eight standards converge across annual, daily, and unspecified averaging times (including LEED v5, WELL Enhanced, LBC, Fitwel, and SS 554).
WHO alignment point: WHO AQG Daily guideline is 25 µg/m³, sitting between annual targets (10–20 µg/m³) and common certification caps (40 µg/m³).
Mid-range progression: Steps through WHO Interim 2 and EU Directive By 2030 at 50 µg/m³ (Daily), EPA NAAQS Annual at 100 µg/m³, WHO Interim 1 at 120 µg/m³ (Daily), HKGBC BEAM Plus at 150 µg/m³, and China Green Building Std 6 Pts and 3 Pts at 160–180 µg/m³.
Upper end: EPA NAAQS Primary Short-term at 188 µg/m³, capped by EU Directive 2024/2881 By 2030 (Short-term) and China GB/T 18883-2022 at 200 µg/m³.
Type split: Long-term annual targets (10–40 µg/m³) dominate strict government and certification standards, whereas short-term peak limits (160–200 µg/m³) define the upper end.
What the Results Mean
NO₂ shows the largest spread in the dataset, heavily dictated by averaging times. Strict annual averages (10–40 µg/m³) protect against long-term cardiovascular and respiratory risks, forming the backbone of WHO guidelines and green building ratings. In contrast, short-term and 24-hour limits (50–200 µg/m³) serve as peak safety caps to catch sudden spikes from indoor gas combustion or heavy outdoor traffic.
Comparison Table
| Standard | Limit | Averaging | Type |
|---|---|---|---|
| WHO (AQG) | 10 µg/m³ | Annual | Government |
| WHO (Interim 3) | 20 µg/m³ | Annual | Government |
| Directive (EU) 2024/2881 (By 2030) | 20 µg/m³ | Annual | Government |
| DGNB (High Danger) | 20 µg/m³ | Annual | Certification |
| WHO (AQG) | 25 µg/m³ | Daily | Government |
| WHO (Interim 2) | 30 µg/m³ | Annual | Government |
| WHO (Interim 1) | 40 µg/m³ | Annual | Government |
| Directive (EU) 2024/2881 (By 2026) | 40 µg/m³ | Annual | Government |
| LEED v5 O+M | 40 µg/m³ | Unspecified | Certification |
| WELL (Enhanced) | 40 µg/m³ | Unspecified | Certification |
| LBC | 40 µg/m³ | Unspecified | Certification |
| Fitwel | 40 µg/m³ | Annual | Certification |
| DGNB (High Danger) | 40 µg/m³ | Annual | Certification |
| SS 554 | 40 µg/m³ | Daily | Government |
| WHO (Interim 2) | 50 µg/m³ | Daily | Government |
| Directive (EU) 2024/2881 (By 2030) | 50 µg/m³ | Daily | Government |
| EPA NAAQS (Primary & Secondary) | 100 µg/m³ | Annual | Government |
| WHO (Interim 1) | 120 µg/m³ | Daily | Government |
| HKGBC BEAM Plus (Global) | 150 µg/m³ | Daily | Certification |
| China Green Building Std - 6 Pts | 160 µg/m³ | Short-term | Certification |
| China Green Building Std - 3 Pts | 180 µg/m³ | Short-term | Certification |
| EPA NAAQS (Primary) | 188 µg/m³ | Short-term | Government |
| Directive (EU) 2024/2881 (By 2030) | 200 µg/m³ | Short-term | Government |
| China GB/T 18883-2022 | 200 µg/m³ | Short-term | Government |
SO₂ Comparison
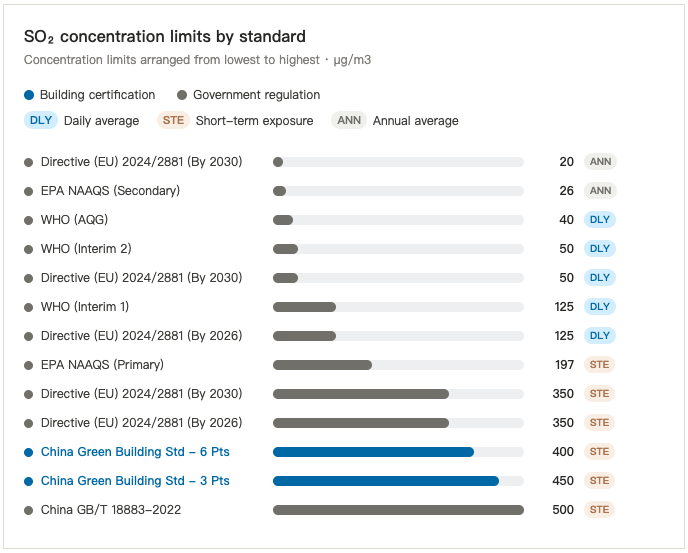
Comparison Results
Range: 20 to 500 µg/m³, a 25-fold gap, across 13 limits.
Strictest: EU Directive 2024/2881 By 2030 (Annual) at 20 µg/m³, followed by EPA NAAQS Secondary (Annual) at 26 µg/m³ and WHO AQG (Daily) at 40 µg/m³.
Most common value: 50, 125, and 350 µg/m³, each shared by two government framework targets.
WHO alignment point: WHO AQG Daily limit at 40 µg/m³ establishes the strict daily baseline, progressing to WHO Interim 2 at 50 µg/m³ and WHO Interim 1 at 125 µg/m³.
Mid-range progression: Advances from daily WHO interim targets (50–125 µg/m³) to EPA NAAQS Primary Short-term at 197 µg/m³ and EU Directive Short-term limits at 350 µg/m³.
Upper end: China Green Building Std 6 Pts at 400 µg/m³, 3 Pts at 450 µg/m³, and China GB/T 18883-2022 at 500 µg/m³.
Type split: Government regulations define virtually the entire progression (20–350 µg/m³), with voluntary building certifications appearing only at the upper short-term thresholds (400–450 µg/m³).
What the Results Mean
Unlike other parameters, SO₂ is governed almost exclusively by public environmental regulations. SO₂ is also a key precursor of acid deposition, commonly known as acid rain, alongside nitrogen oxides, which helps explain its prominence in public environmental regulation. Averaging times split sharply between long-term annual baselines (20–26 µg/m³) and short-term 1-hour/24-hour peak caps (125–500 µg/m³) to reduce acute respiratory effects during pollution events. Voluntary building certifications largely defer to municipal outdoor controls.
Comparison Table
| Standard | Limit | Averaging | Type |
|---|---|---|---|
| Directive (EU) 2024/2881 (By 2030) | 20 µg/m³ | Annual | Government |
| EPA NAAQS (Secondary) | 26 µg/m³ | Annual | Government |
| WHO (AQG) | 40 µg/m³ | Daily | Government |
| WHO (Interim 2) | 50 µg/m³ | Daily | Government |
| Directive (EU) 2024/2881 (By 2030) | 50 µg/m³ | Daily | Government |
| WHO (Interim 1) | 125 µg/m³ | Daily | Government |
| Directive (EU) 2024/2881 (By 2026) | 125 µg/m³ | Daily | Government |
| EPA NAAQS (Primary) | 197 µg/m³ | Short-term | Government |
| Directive (EU) 2024/2881 (By 2030) | 350 µg/m³ | Short-term | Government |
| Directive (EU) 2024/2881 (By 2026) | 350 µg/m³ | Short-term | Government |
| China Green Building Std - 6 Pts | 400 µg/m³ | Short-term | Certification |
| China Green Building Std - 3 Pts | 450 µg/m³ | Short-term | Certification |
| China GB/T 18883-2022 | 500 µg/m³ | Short-term | Government |
Radon Comparison
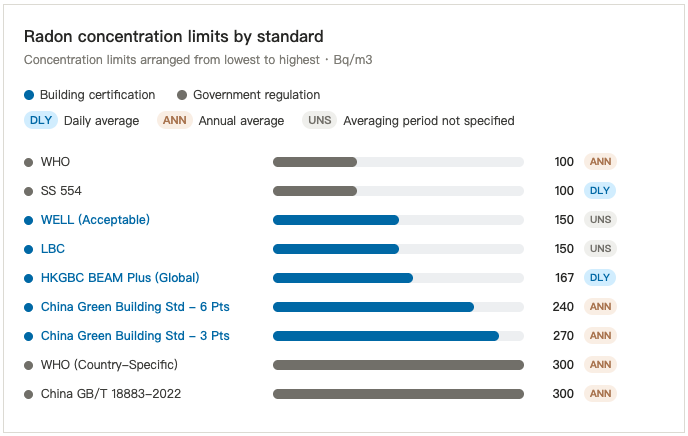
Comparison Results
Range: 100 to 300 Bq/m³, a 3-fold gap, across 9 limits.
Strictest: WHO Guidelines (Annual) and SS 554 (Daily) at 100 Bq/m³.
Most common value: 100, 150, and 300 Bq/m³, with two standards meeting at each threshold.
WHO alignment point: WHO baseline at 100 Bq/m³ matches Singapore SS 554, setting the benchmark before country-specific allowances rise to 300 Bq/m³.
Mid-range progression: Moves from 100 Bq/m³ to WELL Acceptable and LBC at 150 Bq/m³, HKGBC BEAM Plus at 167 Bq/m³, and China Green Building Std 6 Pts and 3 Pts at 240 and 270 Bq/m³.
Upper end: WHO Country-Specific Reference Level and China GB/T 18883-2022 at 300 Bq/m³.
Type split: Health guidelines and national codes anchor both the absolute minimum (100 Bq/m³) and maximum (300 Bq/m³), while commercial building certifications populate the middle tier (150–270 Bq/m³).
What the Results Mean
Radon targets range from 100 to 300 Bq/m³. WHO sets a 100 Bq/m³ annual reference level, while the comparison includes voluntary certification targets from 150 to 270 Bq/m³ and national reference levels up to 300 Bq/m³. Because radon-related lung-cancer risk is associated with cumulative exposure over time, a short-term measurement may not represent the long-term concentration that determines risk. Targets therefore need to be interpreted alongside their averaging periods.
Unlike the other pollutants in this article, radon enters buildings primarily from the ground. Standard air filtration is not its primary control strategy. Effective mitigation generally focuses on foundation sealing, pressure management, and, where needed, active sub-slab depressurization.
Comparison Table
| Standard | Limit | Averaging | Type |
|---|---|---|---|
| WHO | 100 Bq/m³ | Annual | Government |
| SS 554 | 100 Bq/m³ | Daily | Government |
| WELL (Acceptable) | 150 Bq/m³ | Unspecified | Certification |
| LBC | 150 Bq/m³ | Unspecified | Certification |
| HKGBC BEAM Plus (Global) | 167 Bq/m³ | Daily | Certification |
| China Green Building Std - 6 Pts | 240 Bq/m³ | Annual | Certification |
| China Green Building Std - 3 Pts | 270 Bq/m³ | Annual | Certification |
| WHO (Country-Specific) | 300 Bq/m³ | Annual | Government |
| China GB/T 18883-2022 | 300 Bq/m³ | Annual | Government |
Conclusion: What the Ozone, NO₂, SO₂, and Radon Targets Tell Us
This comparison shows that an indoor-air target is not a universal definition of clean air. Standards set different limits because they address different exposure periods, health objectives, local environmental conditions, and practical constraints on building operation.
The most important distinction is the pollutant’s source pathway. Ozone and sulfur dioxide are generally linked to outdoor air quality, so building performance depends on outdoor conditions, air-intake design, and—where appropriate—gas-phase filtration. Nitrogen dioxide can enter from outdoors or be generated by indoor combustion, making source control and effective exhaust especially important. Radon enters from the ground, shifting the focus to long-term testing, foundation sealing, pressure management, and, where needed, sub-slab depressurization.
For owners, designers, and operators, the practical lesson is to look beyond the concentration limit alone. A meaningful IAQ strategy considers the pollutant, its averaging period, its likely source, and the controls that can actually reduce exposure. Organizations working across multiple markets should not assume that meeting one framework guarantees alignment with another.
This comparison will help inform RESET’s future consideration of how these parameters could be incorporated into the RESET Air Standard.
Appendix: Standards List and Resources for Inorganic Gases & Radon
Government standards, codes, and guidelines (5 total):
World Health Organization (WHO). WHO Global Air Quality Guidelines: Executive Summary. p. 4.
US EPA NAAQS — National Ambient Air Quality Standards: NAAQS Table
EU Directive 2024/2881: EU Directive 2024/2881, Annex I
Singapore SS 554 (2021) : SS 554:2016+A1:2021 Code of Practice for Indoor Air Quality for Air-Conditioned Buildings. p. 24.
China GB/T 18883-2022: GB/T 18883-2022 室内空气质量标准. p. 3.
Building certifications and private frameworks (8 total):.
LEED v5 O+M: LEED v5 Reference Guide for Building Operations and Maintenance. November 2025 Edition, pp. 67–70.
WELL v2: The WELL Building Standard v2.
Fitwel: Fitwel v3 Indoor Air Quality Assessment Protocol. p. 13.
Living Building Challenge (LBC): Living Building Challenge 4.1 Program Manual. January
DGNB: DGNB System – Buildings In Use, Criteria Set Version 2026. 2026, pp. 99.
BOMA BEST: BOMA BEST Field Guide.
HK BEAM PLUS: Existing Buildings Global Version. p. 157.
China Green Building Standard: 《绿色建筑评价标准》. 2024, p. 6.
